Request a demoFor you
NorskEnglish
Menu

Appearance

Fitness Age at your gym

Different qualities. Different patterns.

Strength, jump performance and balance describe different aspects of what your body can do. Fitness Age puts the results in the context of age.

Fitness Age describes test performance, not biological age.
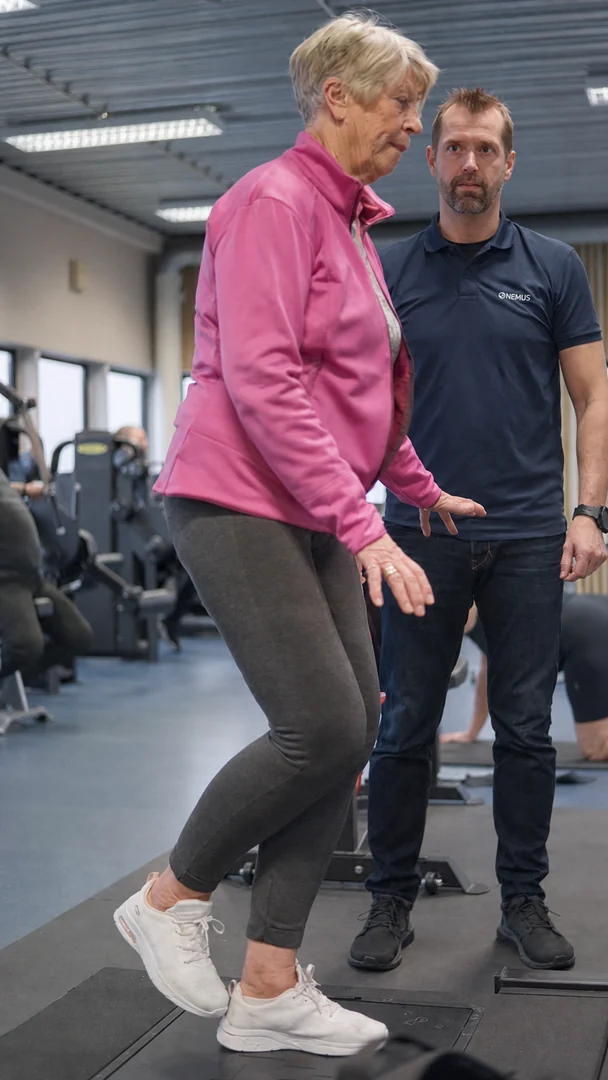
An older woman balances on one leg on the Alphatek platform, with a trainer beside her.
Guided balance training on the Alphatek platform.AI-retouched photo
ILLUSTRATION

Physical capacity and age

Percentage of each curve's illustrated peak

  • Muscle mass
  • Strength
  • Explosiveness (RFD)
  • Balance (stance time)
Physical capacity and ageFour illustrated curves from age 20 to 90: muscle mass, strength, explosive performance (RFD) and balance. End values are 70, 50, 30 and 10 percent. All points are also available in the table.01020304050607080901002030405060708090Age (years)70%50%30%10%Physical capacity and ageFour illustrated curves from age 20 to 90: muscle mass, strength, explosive performance (RFD) and balance. End values are 70, 50, 30 and 10 percent. All points are also available in the table.0204060801002040608090Age (years)70%50%30%10%
Muscle mass
95 Percentage of each curve's illustrated peak
Strength
92 Percentage of each curve's illustrated peak
Explosiveness (RFD)
92 Percentage of each curve's illustrated peak
Balance (stance time)
78 Percentage of each curve's illustrated peak
An illustration, not observed study results or an individual forecast. The balance curve illustrates stance time, not the platform's DIF result.
Show values and explanation

The orange curve follows ‘Muscle power (RFD)’ in the reference image. RFD describes how quickly force rises and differs from mechanical power in watts. The first three curves were read from the image; balance comes from the earlier illustration brief. The points are not a pooled study analysis or a validation of Fitness Age. Lines between points are linear interpolation.

Illustrative values, not observed study results. Each curve's highest value is set to 100.
AgeMuscle massStrengthRFDBalance
20100 %100 %100 %100 %
30100 %100 %100 %96 %
4098 %96 %97 %90 %
50 — Selected age95 %92 %92 %78 %
6090 %84 %84 %62 %
7083 %74 %70 %41 %
8076 %62 %50 %22 %
9070 %50 %30 %10 %

Three aspects of physical capacity.

Muscle quantity alone does not tell you what your body can do. That is why Fitness Age assesses several qualities.

Strength

How much force you produce in a controlled static pull. The result is shown in kilograms.

Jump performance

How high you jump. Jump height is measured in centimetres.

Balance

How steadily you stand on one leg. Both sides are assessed.

From a result to your next step.

Review the results with your trainer. What would you like to work on, and how can your training support that?

Repeat the tests under similar conditions to track progress. Consider changes alongside day-to-day readiness, measurement variation and the training completed.

Fitness Age at your gym
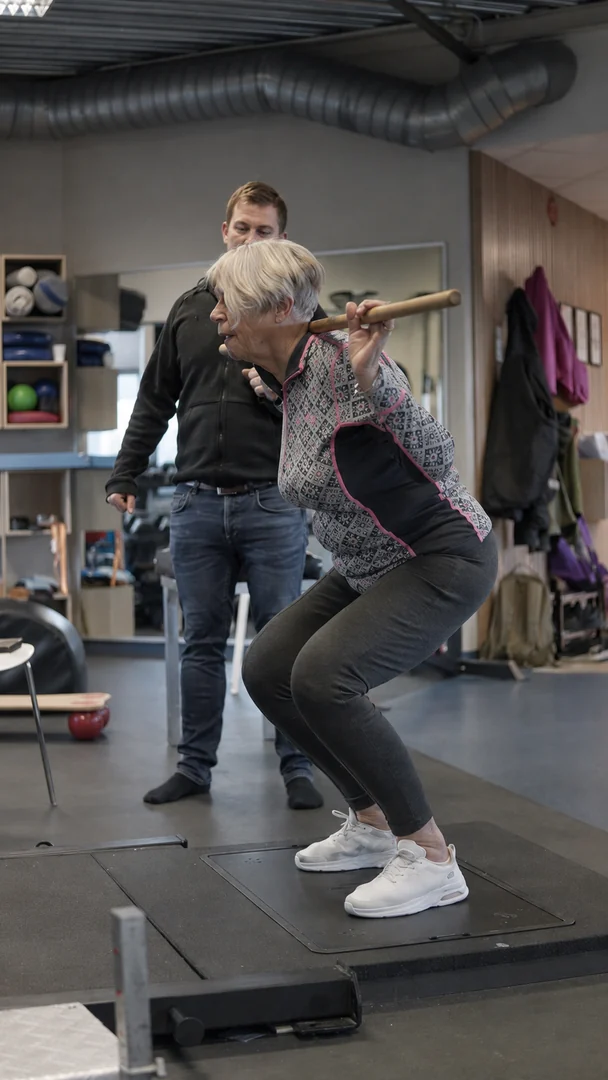
An older woman performs a squat with a bar across her shoulders on the Alphatek platform, with a trainer behind her.
A guided squat on the Alphatek platform.AI-retouched photo

If you would like to know more

Research background and methods

Muscle mass does not tell the whole story.

Age differences are not only a question of old age. Metter and colleagues examined upper-body strength and power and found age-related differences from around 40 in their data. Findings differed between women and men. [4]

Muscle mass

Janssen and colleagues assessed muscle mass in 468 women and men aged 18–88. Muscle quantity describes body composition; it is not itself a measure of performance. [1] [2]

Strength

In the Health ABC study of older adults, leg strength declined faster than leg lean mass over three years. Changes in muscle mass did not explain all of the change in strength. [3] [9]

Explosive performance

Studies of mechanical power and rapid force development examine different aspects of explosive performance. Findings depend on the test, muscle group, age and sex. [4] [5] [6] [7] [8]

Balance needs its own scale

Standing on one leg with eyes closed is measured in time. A force platform can examine sway during a specific test. Both describe aspects of balance, but they produce different measures. Springer and colleagues examined stance time in 549 healthy adults; Era and colleagues used force-platform testing as part of a Finnish population survey. [10] [12]

Stance time and the platform's DIF result describe different measures and are not interchangeable. A percentage of stance time is not the same quantity as a percentage of force or muscle mass.

Methods and limitations

  • RFD describes how quickly force rises, for example in newtons per second. Mechanical power is force multiplied by velocity and is measured in watts. They are not the same quantity. Jump height in centimetres is not a direct measure of power either.
  • A cross-sectional study compares people in different age groups. A longitudinal study follows the same people over time. Findings from these methods are not interchangeable.
  • The studies use different samples, test protocols and muscle groups. Group patterns are not a forecast for an individual or a biological ceiling on what someone can achieve.
  • This literature does not validate the Fitness Age algorithm. The score's reliability and sensitivity to change require separate evidence. Fitness Age describes test performance compared with age reference data, not biological age.
Sources

These 12 references provide context for the qualities and measurement methods. They are not direct sources for each percentage point on a shared ageing curve.

  1. Janssen, I., Heymsfield, S. B., Wang, Z., & Ross, R. (2000). Skeletal muscle mass and distribution in 468 men and women aged 18–88 yr. Journal of Applied Physiology, 89(1), 81–88. Open source (opens in a new tab)
  2. Mitchell, W. K., Williams, J., Atherton, P., Larvin, M., Lund, J., & Narici, M. (2012). Sarcopenia, dynapenia, and the impact of advancing age on human skeletal muscle size and strength: A quantitative review. Frontiers in Physiology, 3, 260. Open source (opens in a new tab)
  3. Goodpaster, B. H., et al. (2006). The loss of skeletal muscle strength, mass, and quality in older adults: The Health, Aging and Body Composition Study. The Journals of Gerontology: Series A, 61(10), 1059–1064. Open source (opens in a new tab)
  4. Metter, E. J., Conwit, R., Tobin, J., & Fozard, J. L. (1997). Age-associated loss of power and strength in the upper extremities in women and men. The Journals of Gerontology: Series A, 52A(5), B267–B276. Open source (opens in a new tab)
  5. Skelton, D. A., Greig, C. A., Davies, J. M., & Young, A. (1994). Strength, power and related functional ability of healthy people aged 65–89 years. Age and Ageing, 23(5), 371–377. Open source (opens in a new tab)
  6. Alcazar, J., et al. (2020). Age- and sex-specific changes in lower-limb muscle power throughout the lifespan. The Journals of Gerontology: Series A, 75(7), 1369–1378. Open source (opens in a new tab)
  7. Klass, M., Baudry, S., & Duchateau, J. (2008). Age-related decline in rate of torque development is accompanied by lower maximal motor unit discharge frequency during fast contractions. Journal of Applied Physiology, 104(3), 739–746. Open source (opens in a new tab)
  8. Thompson, B. J., et al. (2014). Age-related changes in the rate of muscle activation and rapid force characteristics. Age, 36(2), 839–849. Open source (opens in a new tab)
  9. Hughes, V. A., et al. (2001). Longitudinal muscle strength changes in older adults: Influence of muscle mass, physical activity, and health. The Journals of Gerontology: Series A, 56(5), B209–B217. Open source (opens in a new tab)
  10. Era, P., et al. (2006). Postural balance in a random sample of 7,979 subjects aged 30 years and over. Gerontology, 52(4), 204–213. Open source (opens in a new tab)
  11. Rezaei, A., et al. (2024). Age-related changes in gait, balance, and strength parameters: A cross-sectional study. PLOS ONE, 19(10), e0310764. Open source (opens in a new tab) · Read the 2026 correction (opens in a new tab)
  12. Springer, B. A., Marin, R., Cyhan, T., Roberts, H., & Gill, N. W. (2007). Normative values for the unipedal stance test with eyes open and closed. Journal of Geriatric Physical Therapy, 30(1), 8–15. Open source (opens in a new tab)
Research library